Local authorities need accurate information about the size, make-up and distribution of the population across the region, now and into the future, to inform planning for infrastructure and local services. This information can also be useful to inform future planning for community organisations and businesses.
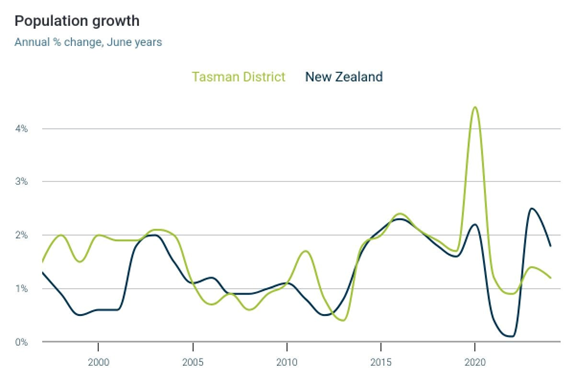
Like the rest of the country, Tasman is experiencing relatively high population growth. In the 2023 Census, Tasman had the highest growth of all the regions, at 10.3% between 2018 and 2023. All other regions grew by less than 9%. Of the 67 territorial authorities, Tasman experienced the 10th highest growth rate.
As at 30 June 2024, Tasman District has an estimated population of 60,000 people.

Figure 1: Population in Tasman compared to New Zealand, 1997 - 2024.
|
Population Estimates by Ward |
2019 |
2020 |
2021 |
2022 |
2023 |
2024 |
Change since 2019 |
% increase since 2019 |
|
Tasman district |
54,900 |
57,300 |
58,000 |
58,500 |
59,300 |
60,000 |
2,700 |
9% |
|
Golden Bay ward |
5,430 |
5,630 |
5,750 |
5,740 |
5,730 |
5,730 |
300 |
6% |
|
Lakes-Murchison ward |
3,890 |
4,080 |
4,120 |
4,150 |
4,190 |
4,100 |
210 |
5% |
|
Moutere-Waimea ward |
14,850 |
15,450 |
15,750 |
16,050 |
16,150 |
16,300 |
1,450 |
10% |
|
Motueka ward |
13,200 |
13,700 |
13,600 |
13,500 |
13,600 |
13,550 |
350 |
3% |
|
Richmond ward |
17,550 |
18,500 |
18,800 |
19,100 |
19,650 |
20,400 |
2,850 |
16% |
Table 1: Population estimates by ward, 2019-2024
|
Ward Population Structure by Age Group |
Total people |
Median age |
Proportion of Ward |
|||
|
0-14 Years |
15-39 Years |
40-64 Years |
65 Years + |
|||
|
Tasman district |
60,000 |
47 |
16% |
26% |
34% |
24% |
|
Golden Bay ward |
5,730 |
50.9 |
15% |
22% |
36% |
27% |
|
Lakes-Murchison ward |
4,100 |
46.8 |
15% |
27% |
36% |
21% |
|
Moutere-Waimea ward |
16,300 |
48.4 |
17% |
23% |
38% |
22% |
|
Motueka ward |
13,550 |
46.9 |
15% |
28% |
32% |
26% |
|
Richmond ward |
20,400 |
44.4 |
16% |
29% |
31% |
24% |
Table 2: Age group proportions by ward, 2024
|
Tasman Ethnic Proportion by Census Year |
2013 (%) |
2018 (%) |
2023 (%) |
|
European |
93.1% |
92.6% |
90.7% |
|
Māori |
7.6% |
8.7% |
9.9% |
|
Pacific Peoples |
1.1% |
1.6% |
2.6% |
|
Asian |
2.0% |
2.8% |
4.0% |
|
Middle Eastern/Latin American/African |
0.3% |
0.5% |
0.8% |
|
Other ethnicity |
2.4% |
1.5% |
1.6% |
Table 3: Ethnic proportion by Census year, 2013-2023
Take a look at the results of the 2018 New Zealand General Social Survey to see how we stack up against other regions in NZ in terms of self-assessed well-being. Social Well-being - StatsNZ
Since 2018, Tasman’s dwelling count has increased by 11% to 26,352 in 2023. On average, Tasman dwellings have 3.1 bedrooms, with no change between 2018 and 2023, and the same as the national average.
Tasman’s overall home ownership rate has increased slightly, from 76% in 2018 to 77% in 2023. This is the percent of households in dwellings which are owned, partly owned, or held in a family trust. Tasman has the 7th highest home ownership rate compared to other territorial authorities.
Data from the Ministry of Housing and Urban Development shows a steep rise in house prices in Nelson and Tasman between 2016 and 2022. Since then, house prices have reduced, with the median sales price for Tasman sitting at $751,000 as at June 2024.
Population projections and demographic trends are a key consideration in the Council’s forward planning. For the Long Term Plan 2024-2034, DOT Consulting has provided Tasman District Council and Nelson City Council with a set of population, household, and dwelling projections to 2058. The District will experience ongoing population growth over the next 30 years but the rate of growth will slow over time. Population ageing is driving changes in age structure.
Council has assumed the medium scenario, which projects the overall population of Tasman to increase by 7,400 residents between 2024 and 2034, to reach 67,900.
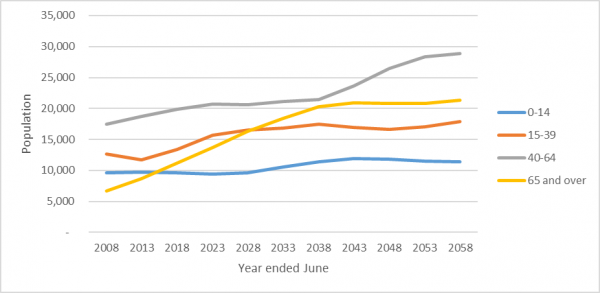
Under the medium scenario, all age groups in Tasman are projected to experience growth. However, the highest growth continues to be in the 65+ age group, which is projected to increase by 50% between 2023 and 2053. The proportion of the population in this age group is projected to increase from 23% to 28% by 2034.

Figure 2. Historic and projected Tasman population by age group, 2008-2058
By 2038, the percentage of Tasman's population who identify as Māori is projected to reach 12%. Between 2013 and 2038, the number of Asian residents is projected to triple, from 2% to 6%, and the number of Pacific people is projected to double, from 1% to 2%.
For more information, read the Tasman District Population Projections 2018 – 2053 report. Note that the Council adopted a medium growth scenario. Tasman's Growth Model
GDP in Tasman District measured $3,115.3m in the year to March 2023, up 3.7% from a year earlier. Growth was greater than in New Zealand (2.8%). Tasman District accounted for 0.8% of national GDP in 2023.
A total of 7,686 business units were recorded in Tasman District in February 2023, up 2.3% from a year earlier. Growth was greater than in New Zealand (1.7%).
Table 4. Top Five Broad Industries in Tasman District for Contribution to GDP & Employment, 2023
|
Biggest Contributor to GDP |
Biggest Contributor to Employment |
|
Manufacturing |
Agriculture, Forestry, and Fishing |
|
Agriculture, Forestry, and Fishing |
Construction |
|
Construction |
Manufacturing |
|
Rental, Hiring, and Real Estate Services |
Retail Trade |
|
Professional, scientific and technical services |
Professional, scientific and technical services |
For the latest information on our region, you can download reports from Business insights - NRDA
Total exports from Tasman District were $1,095.8m in 2023, an increase of 2.3% compared to the previous year. By comparison exports increased by 11.9% in New Zealand.
The industry in Tasman District with the highest exports in 2023 was horticulture and fruit growing ($375.5m), followed by wood product manufacturing ($148.4m) and seafood processing ($138.7m).
The type of goods with the highest exports in 2023 was apples, pears and other fruit not included ($256.0m), followed by fresh kiwifruit and berries ($216.7m) and other wood products including sawn, chipped, sliced or peeled wood ($144.5m).
An environmental scan is a snapshot of the current issues and opportunities facing the Tasman District. An Environmental Scan helps us consider the regional, national, and international context shaping the region and identify the long-term trends affecting the district. We develop an Environmental Scan during our Long-Term Plan process every three years.
Here are the environmental scans that we developed for past Long-Term Plans.
Last modified: